
A global internet total can sound like a finish line. It is better understood as a starting point: a count of people who use the network, rather than a verdict on how well it serves them.
The snapshot
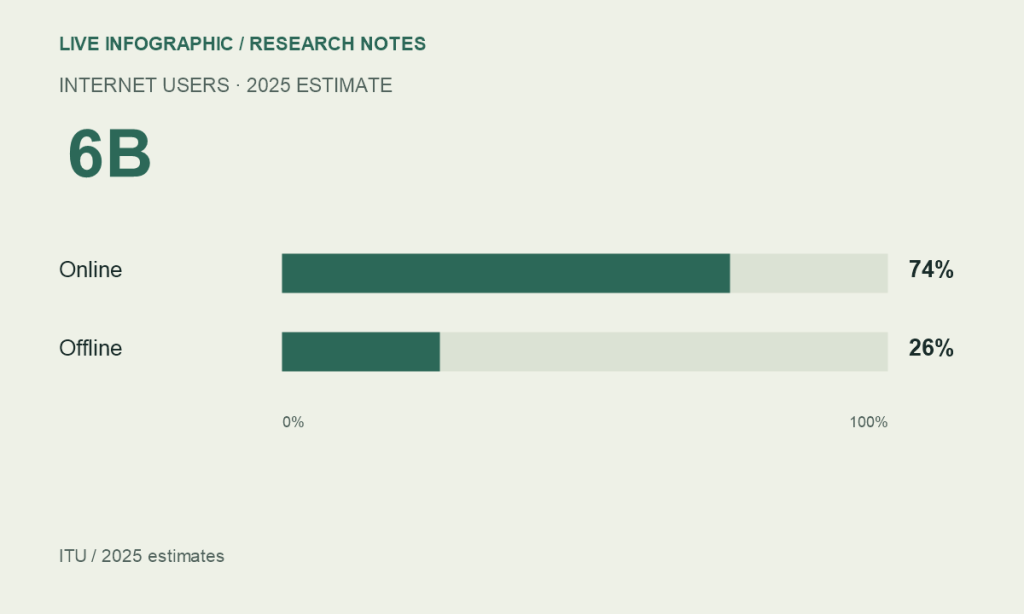
ITU estimated that around 6 billion people used the internet in 2025, while about 2.2 billion remained offline. These are estimates for 2025, not a live counter for 2026. The total says little by itself about connection reliability, affordability or what people can do once connected.
| Indicator | 2025 estimate | How to read it |
|---|---|---|
| People using the internet | 6 billion | A rounded global estimate |
| People offline | 2.2 billion | A substantial remaining access gap |
Three different questions behind “connected”
Access asks whether someone can get online. Quality asks whether the service is reliable enough for the task. Usefulness asks whether the connection supports something that matters to that person. A connection that opens a message may still struggle with a video appointment or an online course.
Consider two hypothetical households. One shares an older phone and buys small prepaid data bundles. Another has several devices and fixed broadband. Both can appear in an internet-use count, but their capacity to learn, work and shop online can differ. This is an illustration of measurement limits, not a claim about the survey’s individual respondents.
What a better dashboard would show
- Internet use alongside the cost of a basic connection.
- Network reliability and the devices people use.
- Urban and rural comparisons with the same definitions.
- The survey year and any revisions to historical estimates.
For publishers, the practical design question is whether a reader with a limited connection can still reach the main information. Lightweight pages, readable text, compressed graphics and tables that work without JavaScript make information less dependent on device power.
A number is useful when its limits travel with it
A world total is helpful for scale. A regional breakdown is useful for comparison. A local study can help explain barriers. These are different views of the same subject; no single graphic needs to perform all three jobs.
When comparing years, use one consistent source series. A revised estimate can change the apparent growth rate even if the underlying experience has not changed. Record the release as well as the year the data describes.
Source & methodology
ITU · Facts and Figures 2025. Source checked October 6, 2026. Figures are attributed to the stated period; this is an explainer, not a live data feed. Interpretation and illustrative examples are identified in the text.
See our editorial policy for sourcing and corrections.