
A slowing inflation rate and an expensive weekly shop can exist at the same time. One describes how fast prices change; the other reflects the level they have reached.
Level and rate are different
The U.S. Bureau of Labor Statistics describes the Consumer Price Index as a measure of average price change for a representative basket of consumer goods and services. A change in an index measures movement over time, rather than the dollar cost of one household’s basket.
When a positive inflation rate gets smaller, prices are still rising on average, just more slowly. A decline in the general price level is a different situation. Individual products can become cheaper even while the broad average rises.
A worked example, not an economic forecast
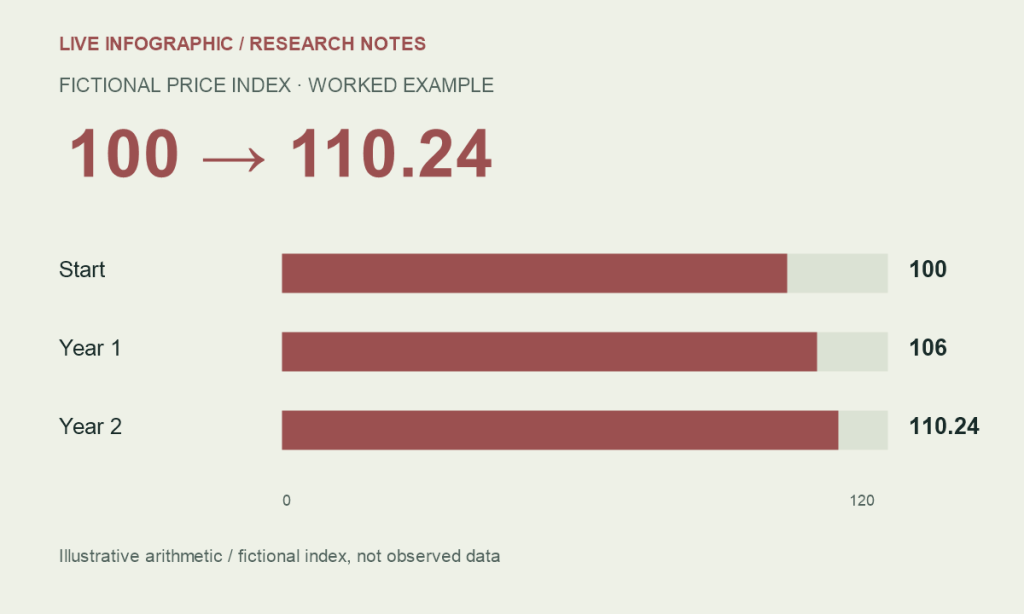
Start with a fictional price index of 100. A 6% increase takes it to 106. A subsequent 4% increase takes it to 110.24. The inflation rate fell, but the index rose in both years. The numbers below are chosen only to explain the arithmetic; they do not describe any country or actual year.
| Period | Illustrative increase | Fictional index |
|---|---|---|
| Start | — | 100.00 |
| Year 1 | 6% | 106.00 |
| Year 2 | 4% | 110.24 |
The second increase applies to 106, not the original 100. That is why the cumulative increase is 10.24%, rather than simply adding the two annual rates. A comparison needs the starting point as well as the rates in between.
Why personal experience differs
A household spending a large share of its budget on one category may experience a different pattern from an average basket. Imagine two fictional households: one faces a new rent payment, while the other owns its home and spends more on transport. The same headline index can be relevant to both without reproducing either one’s budget exactly.
Frequency also changes what is noticeable. A familiar purchase made every week makes a price change visible. An infrequent purchase may have less influence on someone’s impression of the economy. That impression and the statistical measure answer different questions.
A checklist for an inflation headline
- Is the comparison monthly or year over year?
- Is the series seasonally adjusted?
- Which country and consumer population does it cover?
- Does the figure refer to an index level or a percentage change?
- Which categories are included or excluded?
Do not compare a monthly change with an annual change as if the time periods matched. Do not treat a lower rate as a return to an earlier price level. If a headline makes either move, go back to the source table.
The same level-versus-change distinction appears in retail data: our e-commerce explainer shows why nominal sales need careful interpretation.
Source & methodology
U.S. Bureau of Labor Statistics · CPI questions and answers. Source checked October 6, 2026. Figures are attributed to the stated period; this is an explainer, not a live data feed. Interpretation and illustrative examples are identified in the text.
See our editorial policy for sourcing and corrections.