
Opening an account makes a digital payment possible. Whether someone uses it at the grocery store depends on another set of conditions: acceptance, cost, confidence and convenience.
The measured change
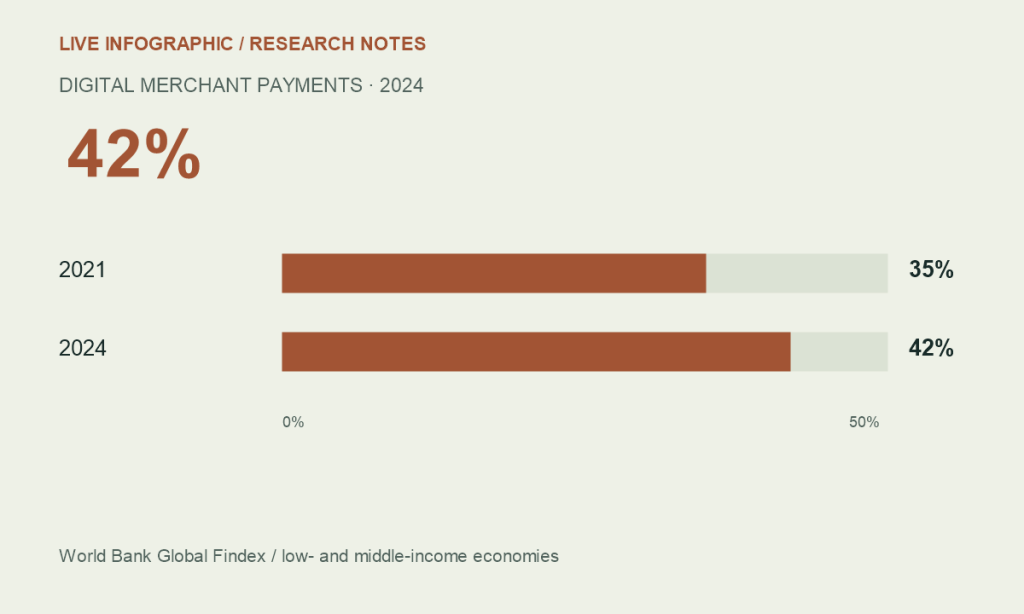
The World Bank’s Global Findex 2025 release reports that 42% of adults in low- and middle-income economies made an in-store or online digital merchant payment in 2024, compared with 35% in 2021. The difference is 7 percentage points. It is not a seven-percent relative increase.
| Year | Share of adults | Scope |
|---|---|---|
| 2021 | 35% | Low- and middle-income economies |
| 2024 | 42% | Same reported economy grouping |
This measure concerns adults making a payment. It does not describe the share of all purchases paid digitally, payment transaction value or the worldwide adoption of one mobile wallet.
Think in stages
A useful way to analyze a payment system is to separate access, first use and repeated use. A person may have an account but lack a nearby merchant who accepts it. Another may pay digitally for one online purchase while using cash for daily spending.
For an illustrative merchant, a new terminal solves only one problem. Staff still need to explain the process, manage failed transactions and reconcile receipts. The consumer needs to understand fees and know what happens if a transfer goes wrong. These operational questions sit outside a simple adoption percentage.
Which measures belong together?
- Reach: adults with an account or access to a suitable device.
- Use: adults who actually made the defined payment.
- Frequency: how often the service is used, when comparable data exists.
- Friction: costs, failed transactions and support access.
A dashboard that mixes these measures without labeling them can exaggerate progress. A person-based statistic cannot be compared directly with a transaction-based one. A global average cannot describe every country in the group.
Read the denominator before the headline
Before quoting a percentage, identify who is counted, the time period and the action that qualifies. “Has an account,” “made a digital payment” and “paid a merchant digitally” answer related but different questions.
For readers following the broader digital economy, payment adoption becomes more useful when paired with a view of internet access and connection quality. A digital product still depends on the practical conditions in which people use it.
Source & methodology
World Bank · Global Findex 2025 release. Source checked October 6, 2026. Figures are attributed to the stated period; this is an explainer, not a live data feed. Interpretation and illustrative examples are identified in the text.
See our editorial policy for sourcing and corrections.