
Two reports can quote different online-shopping shares for the same quarter and both be using the same official release. The difference may be the way the data is adjusted.
A dated snapshot
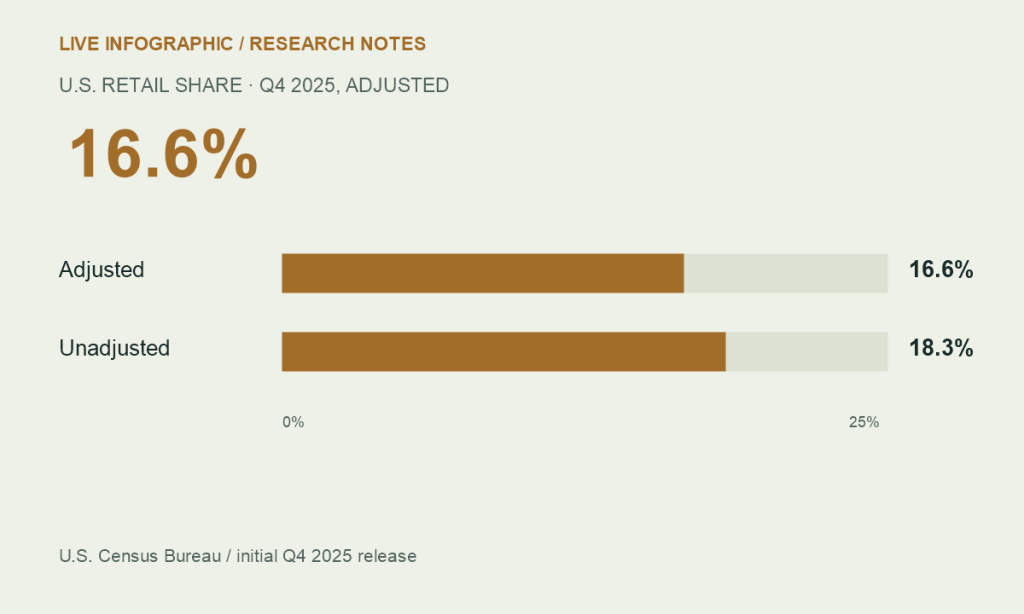
In its initial Q4 2025 release, the U.S. Census Bureau estimated retail e-commerce at 16.6% of total retail sales on a seasonally adjusted basis. The unadjusted share was 18.3%. These are U.S. estimates from a specific historical release, subject to revision, rather than the latest quarter or a global shopping share.
| Q4 2025 measure | Share | Purpose |
|---|---|---|
| Seasonally adjusted | 16.6% | Comparison across quarters |
| Not adjusted | 18.3% | Observed seasonal period |
The estimates adjust for seasonality, not price changes. The release counts orders placed or negotiated through specified electronic systems; payment need not occur online. Its retail scope excludes areas such as online travel services. The denominator is therefore narrower than every kind of consumer spending.
What seasonal adjustment does
A hypothetical retailer might sell more gifts during a holiday quarter even if its underlying customer base is unchanged. Seasonal adjustment aims to make recurring calendar patterns less dominant in a comparison. It is a statistical treatment, not a second category of purchases.
Use adjusted values to explore a quarter-to-quarter pattern. Use an explicitly labeled unadjusted series when the observed seasonal period is the point. Switching between the two partway through a chart can create a false change.
Sales growth is not unit growth
Dollar sales can rise when prices rise, when more items are sold or when buyers choose a different mix of products. A nominal sales figure alone cannot tell these effects apart. The same caution applies to a company dashboard that celebrates revenue without tracking margin or returns.
- Keep the geography consistent.
- Use one adjustment basis throughout the comparison.
- Label preliminary and revised estimates.
- State whether the figures are adjusted for prices.
- Explain what the retail category excludes.
A useful business comparison
For an individual retailer, compare online and offline activity using the same order definitions, period and return treatment. A shopper who researches online but buys in a store may not appear in an online sales total. That does not mean the digital channel played no role.
This is why a channel’s share is only one view of buying behavior. Our guide to digital payment adoption makes a similar distinction between people using a service and the transactions it processes.
Source & methodology
U.S. Census Bureau · Q4 2025 retail e-commerce release. Source checked October 6, 2026. Figures are attributed to the stated period; this is an explainer, not a live data feed. Interpretation and illustrative examples are identified in the text.
See our editorial policy for sourcing and corrections.